


Are Asians saving too little or too much? And what doest this mean for insurance?


Chief Economist
- Over the past decades, a high savings rate has underpinned Emerging Asia’s strong economic growth. Post-pandemic, national savings rates are broadly trending downward.
- There are though significant differences across markets. In India, a decline in the household financial savings rate, if persisted, could drag on economic growth and demand for insurance.
- In China, a persistently high savings rate is inconsistent with the need to rebalance the domestic economy to become more consumption-driven.
- It is important to ascertain both the level of savings and the underlying reasons for saving in order to determine their impact on insurance demand.
Full article available for download:
Introduction
Asian wisdom encapsulates that saving money is not just about wealth accumulation but also about developing one’s personal virtues and discipline. Emerging Asia’s high savings rates are an important factor that enabled the region’s rapid economic growth over the past decades. High savings stimulate economic development by channelling funds into productive investments, supporting urbanisation and spurring the fast expansion of the region’s manufacturing sectors.[1]
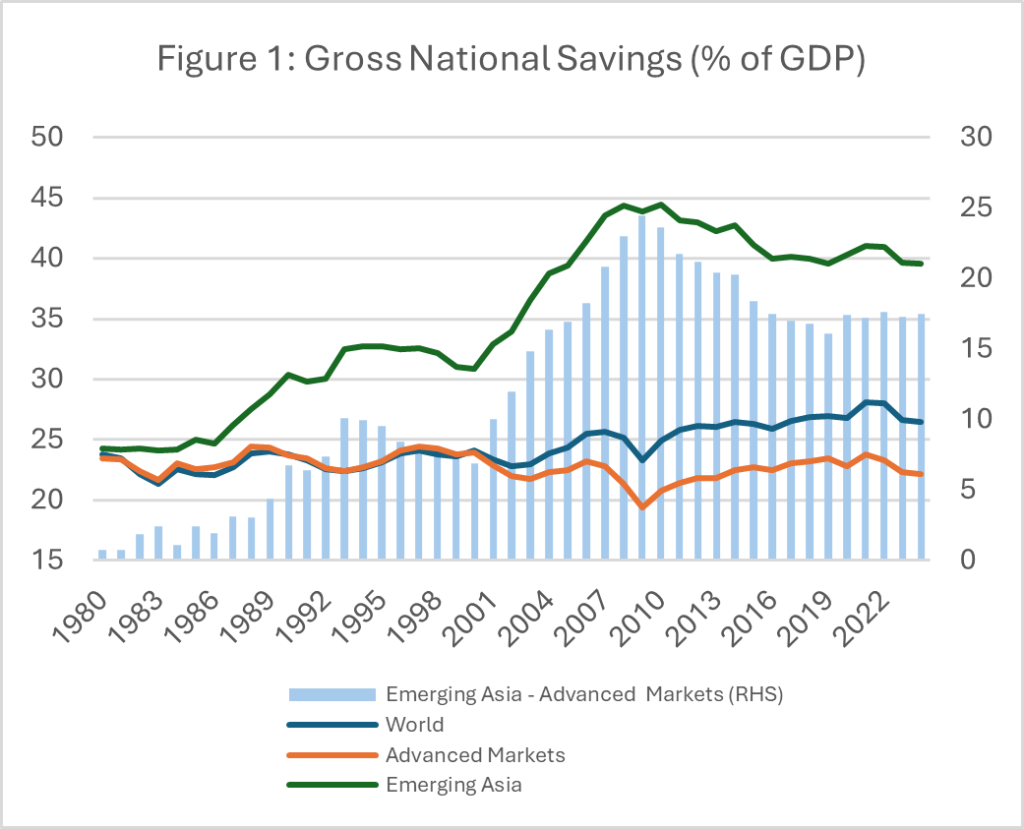
Source: IMF World Economic Outlook Database April 2024.
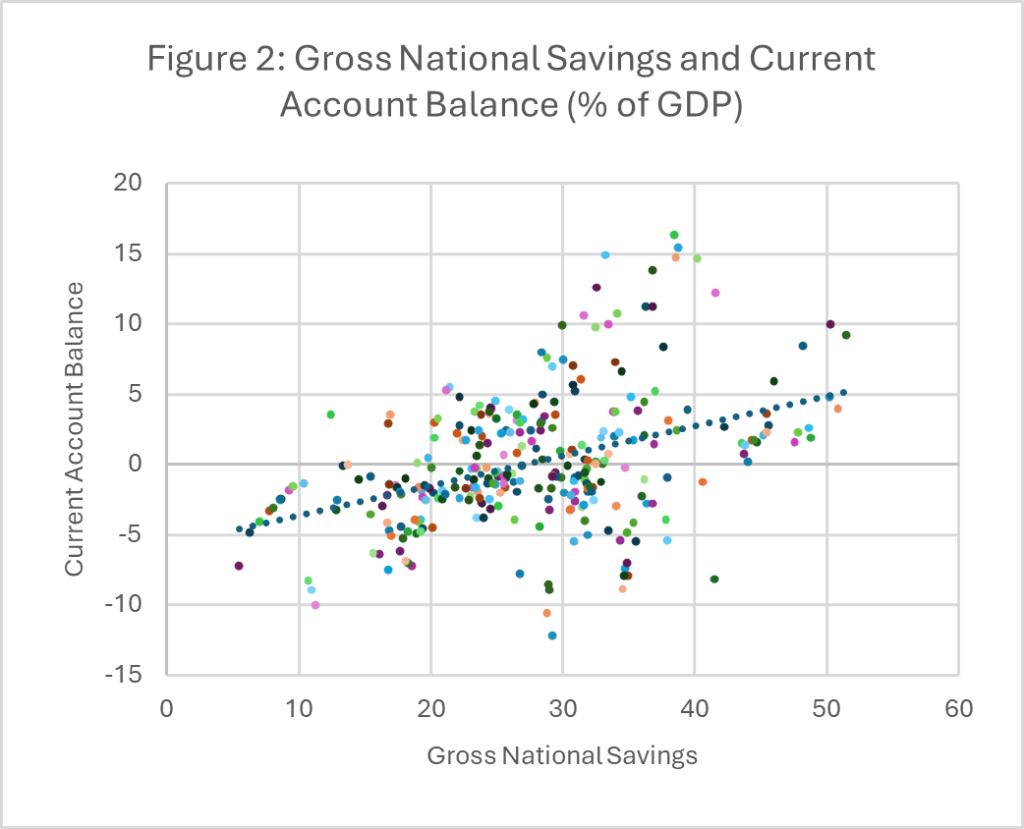
Note: In Figure 2, each data point represents the pair of current account balance and gross national savings for an Emerging Aisa market (including China, India, Indonesia, Malaysia, the Philippines, Thailand and Vietnam) in a year from 1980 to 2024.
As shown in Figure 1, Emerging Asia’s savings rate rose markedly from around 30% to close to 45% during the 2000s, at a time when advanced markets’ savings rate edged lower to 20% from 25%. The gap between Emerging Asia and advanced market savings widened from 2.2ppt in the 1980s to 8.2ppt in the 1990s and 16.4ppt in the 2000s. After further widening to nearly 20ppt in the 2010s, the gap has since narrowed and stabilised. One of the key drivers behind this observed pattern is China, whose savings rate dropped from a peak of 51.6% in 2008 to an estimated 43.8% in 2024. Other key markets like India and Indonesia also experienced slight slowdowns in savings.
Frugality plays a pivotal role in supporting the economic growth of lower-income countries, particularly those with limited access to overseas capital and are distant from the forefront of innovations. This reflects the importance of capital accumulation in driving emerging market economic growth, compared to advanced markets’ heavier reliance on productivity growth (through total factor productivity, TFP)[2]
There is also an international dimension to Asia’s high savings rate. For most Asian markets, the higher savings are not entirely utilised locally. Indeed, a significant portion is funnelled overseas through positive trade balances (see Figure 2). When a country produces more than it consumes, the balance is typically represented as exports to overseas markets. These are primarily invested in overseas sovereign bonds, thus helping to finance overseas consumers to buy Asian exports.
Savings and insurance[3]
Insurance demand is a function of many factors, including local and idiosyncratic ones. Income level is generally considered a key determinant, as illustrated in the S-curve of insurance demand.[4] Attitudinal factors also matter. For instance, risk-aversive consumers are more likely to own insurance. However, consumers’ perceptions of the riskiness of insurance products also matter. It was hypothesised, for example, that risk-aversive consumers were less likely to own term life insurance, which is considered a “risky investment” similar to equity.[5]
The impact of a higher savings rate on insurance is largely positive. However, it also depends on who is saving, whether savings are accrued to households, corporations, or the public sector. The incentives and reasons behind high savings also matter. As long as insurance is considered a savings vehicle by consumers, it competes with other financial instruments like equity, mutual funds, and deposits. The relative returns from different products will largely dictate households’ allocations.
Motives for Household Savings[6]
Savings are not just the residual from monthly income after expenses. While a lack of financial planning is often observed, conscious efforts to save are widespread.
A. Precautionary Motive
Individuals and households would opt for more savings as a way of self-insurance against uncertainties in life, like catastrophic medical expenses. This is more likely the case when the provision of social security is still patchy, and the availability and/or affordability of private insurance is limited. Given that the high (precautionary) savings rate is a result of limited insurance availability/affordability, both from the public and private sectors, it is not expected that the high savings rate would impact demand for insurance. On the other hand, if the availability/affordability of insurance improves, savings could decline.
B. Life Cycle Motive
The ‘Life Cycle Motive’ is a significant driver of insurance demand. It is assumed that consumers, in an effort to smooth out their consumption, save for major life cycle events and expenses, such as purchasing a house or retirement. This implies that the level of savings is largely influenced by the demographic profile of the population. A younger population with a higher savings rate is more likely to demand life insurance and other types of insurance. However, as the population ages and enters the dis-saving phase of its life cycle, the demand for both protection- and saving-type insurance products is expected to decrease.
C. Bequest Motive
Savings, in this context, are primarily intended to leave an inheritance for the next generation. Empirical evidence suggests a positive correlation between the bequest motive and the demand for life (savings-type) insurance products. However, this correlation is not observed for other lines of business. If a high household or national savings rate is primarily driven by the bequest motive, it is reasonable to expect a narrow, though positive, impact on insurance demand.
D. Wealth Accumulation Motive
The marginal propensity to save tends to increase with household wealth. Wealthy households generally save more, partly as the share of necessities in total consumption is lower. The motivation for high net worth (HNW) household savings could be a mix of life cycle, bequest and/or “profit” generation. Insurance demand could increase alongside desires to accumulate wealth, though this would only benefit those savings-related insurance products.
There are other reasons behind changes in household savings. Due to various restrictions and lockdown measures, the COVID pandemic has resulted in higher “involuntary savings” among consumers. Similarly, governments have put in place large fiscal packages to cushion households and corporations from the fallout of the pandemic. This resulted in huge excess savings in the US, estimated at USD 2.1 trillion at its peak in August 2021.[7] The key motives discussed in this section exclude those one-off considerations.
It is also important to consider local market conditions, including societal norms, regulatory changes, socio-economic backdrops and consumer attitudes. Within this context, recent news are highlighting a dichotomy between China and India. While China has a stubbornly high household saving rate that needs to get lower, Indians are debating the reasons behind the recent drop in their household financial savings rate to a multi-year low and measures to reset it to grow again.
India’s household savings: diversification towards non-financial and non-deposit assets
The Indian economy has managed impressive economic growth over the past decade, averaging close to 6% despite a brief recession during the pandemic.[8] Household financial savings spiked significantly in the Financial Year 2020-21 as wholesale lockdowns curbed discretionary spending. The rate of increase in net household savings accelerated to 47% over the year (see Figure 3).
Net household financial savings growth has since moderated. The deceleration in FY2021-22 was largely expected, given the exceptionally high base in the preceding year. However, the slowing trend continued in FY2022-23, with incremental gains falling below the pre-pandemic level. Anecdotal evidence sends a mixed signal on whether the trend would have continued in FY2023-24. There are signs of fast-rising financial liabilities as consumers piled up more personal debts, but bank deposit growth has also accelerated.
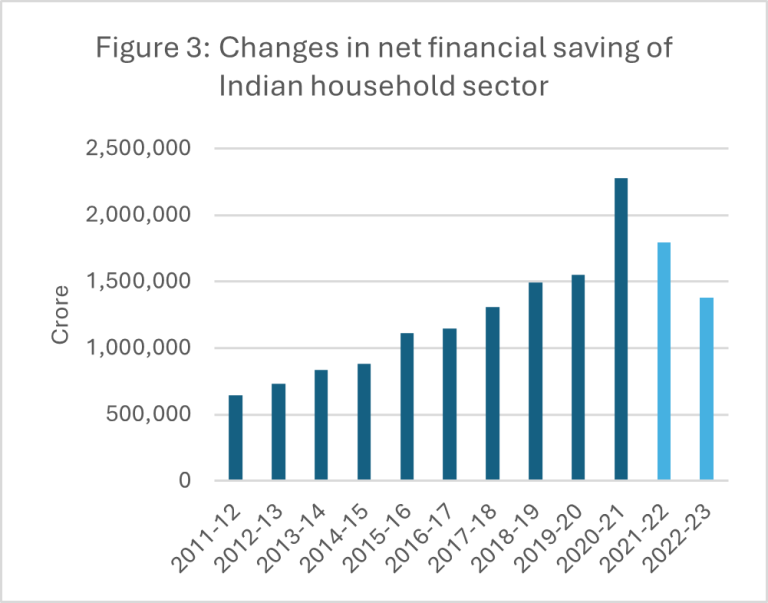
Source: National Accounts Statistics 2023, Ministry of Statistics and Programme Implementation (MoSPI), Government of India, Authors’ calculation based on National Accounts Statistics 2023
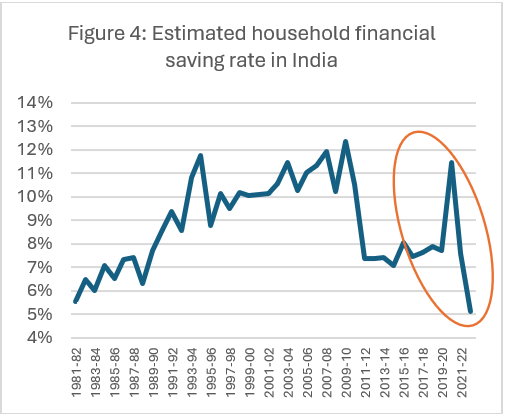
The trend of slowing accumulation of household financial assets means the household financial savings rate (as a percentage of GDP) is decreasing (see Figure 4). Indeed, the savings rate has likely dropped to 5.1% in FY2022-23, the lowest level since records are available from FY1981-82. Between FY2011-12 and FY2019-20, the household savings rate has largely moved within a narrow range of 7-8%.
The drop in the household financial savings rate can be attributed to several factors. On the one hand, the rate of increase in financial assets has steadily slowed in FY2021-22 and FY2022-23, reflecting investment volatility and a reduction in cash holding. Simultaneously, household liability has seen a rapid increase. Borrowing from the banking sector, which constituted the majority of Indian households’ financial liability, rose 12.6% in FY2021-22 and 17.6% in FY2022-23. A significant driver of this trend is the rise in non-housing debts like car, education, and other personal loans. This is partly facilitated by the fast integration of technologies, particularly by non-bank financial companies (NBFCs), to expedite loan applications and approvals.
Meanwhile, the central bank, the Reserve Bank of India (RBI), increased the risk weighting on unsecured loans by 25ppt (from 100% to 125%) in November 2023. As such, the rise in household liability is expected to slow in FY2024-25, which could halt or reverse the fall in net household savings. At the same time, the transmission of higher interest rates could support growth in household savings.
A show of confidence or exuberance?
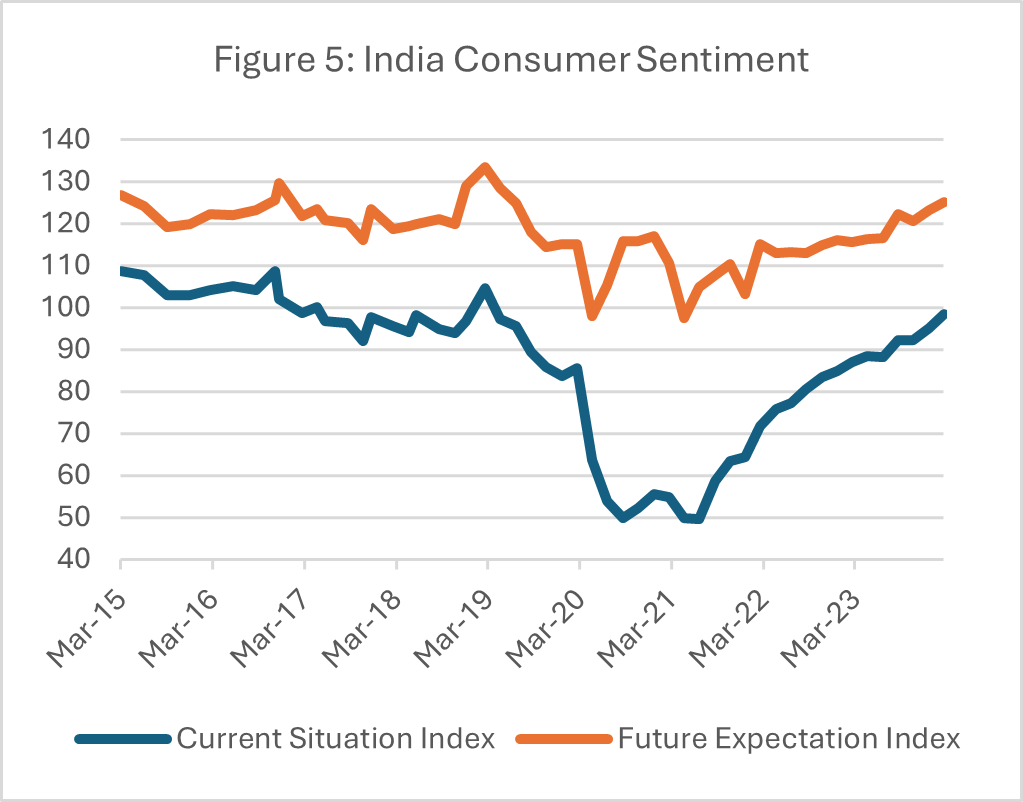
The rise in Indian household financial liability represents primarily an increase in borrowing for consumption, as consumer sentiment improves (see Figure 5) and they are more confident of their financial future. Is it a problem that Indian consumers increasingly rely on debt to fuel consumption?
Source: Reserve Bank of India
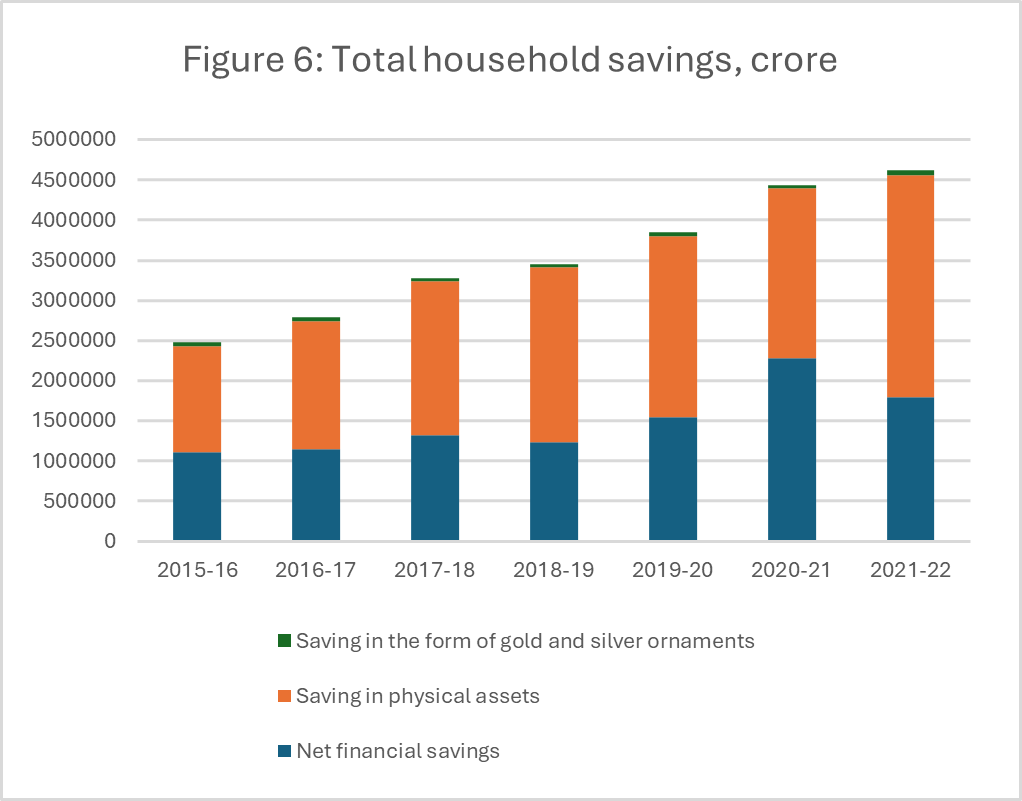
To assess the sustainability of India’s household financial debts, it is helpful to benchmark with countries at similar stages of economic development. Based on the IMF’s Global Debt Database[9], which allows consistent cross-country comparisons, India’s household debt stood at 35.6%[10] of GDP in 2022. The corresponding figures for peers in the region are significantly higher: China was 61.5%, Malaysia 66.9%, and Thailand 87.0%. Only Indonesia has a lower ratio of 16.2%. The rise in household debts in India is consistent with previous observations that such rises are typically associated with higher economic growth and lower unemployment. While there could be implications for financial stability over the medium and long term, much will depend on the combination of local institutions, regulations, and policies.[11] It should be noted that Indian households also invest heavily in physical assets, particularly in gold and silver ornaments. Available data up to FY2021-22 shows an uptick in savings in physical assets at a time when financial savings have dropped (see Figure 6).
Financialisation of household savings
What does this mean to insurance? The drop in net savings was mainly due to a rise in liability (rather than a decline in gross savings/assets). Nonetheless, burdened with higher financial loans and borrowing, interest in wealth-management products and saving-type insurance could decline. Consumers might prioritise protection products. On the other hand, as Indians borrow to finance consumption, there could be increasing demand for car and home insurance, for instance.
Countering this cyclical trend is the increasing financialisation of household savings in India. An estimated 57% of Indian households’ financial savings are stored in cash and deposits, which is higher than the corresponding figures in other advanced Asian and Western markets (see Figure 7). Recent trends suggest that Indians increasingly allocate more of their accumulated wealth into equity, mutual funds, insurance, and pensions. For instance, while bank deposits have grown by an annual rate of 9% over the past decade, non-bank financial products saw an increase of 15%.

Source: Changing contours of Indian household savings, Goldman Sachs
Note: All other savings instruments consist of equity, mutual funds, insurance, pensions and others.
China’s household savings: the high savings paradox
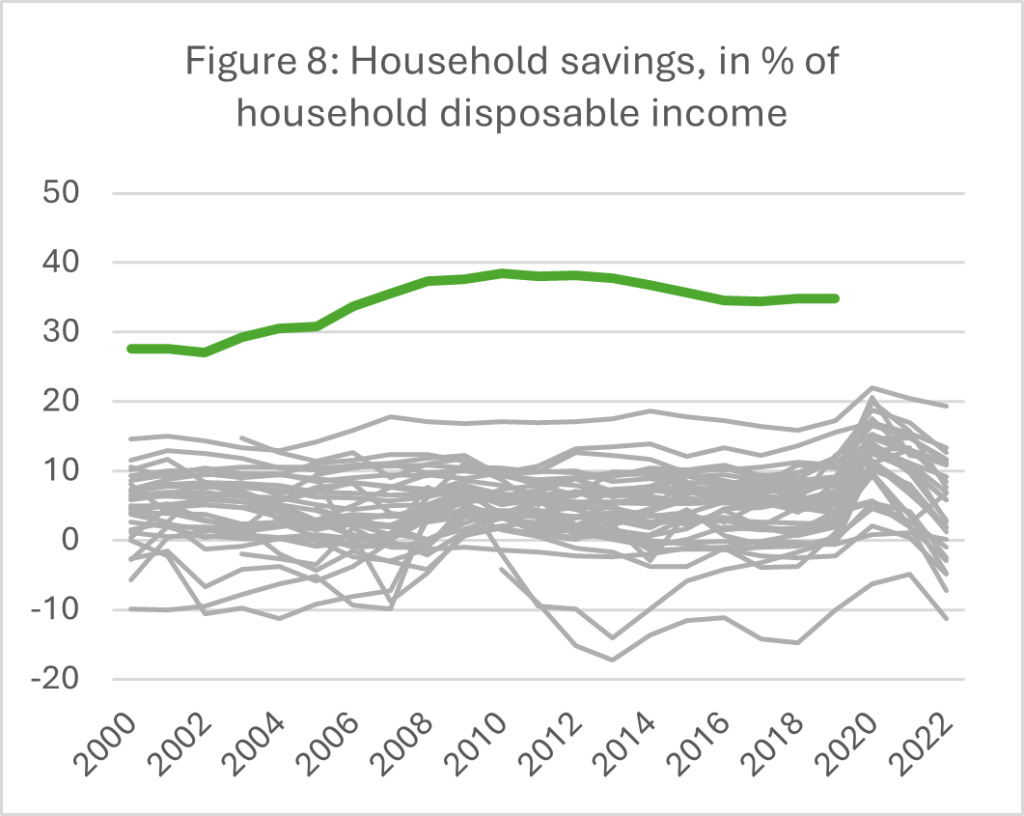
China currently accounts for the biggest share of global savings.[12] Chinese households have long maintained one of the highest savings rates in the world. Indeed, it looks an outlier when compared to other major markets. Data from the OECD shows that Chinese households’ savings rate has consistently exceeded other major economies since comprehensive data were available in 2000 (see Figure 8). The high savings rate could be attributed to a mix of factors.[13] During most of the 2000s and 2010s, China still enjoyed its demographic dividend, whereas a large segment of the labour force was accumulating wealth. Furthermore, the lack of comprehensive social security encouraged households to put aside more savings for rainy days. Third, housing reforms over the past decades that accrued more people with property ownership have encouraged savings to finance housing purchases.
Source: OECD (2024), Household savings (indicator). doi: 10.1787/cfc6f499-en (Accessed on 31 May 2024). Grey lines represent other OCED markets., CEIC, National Bureau of Statistics
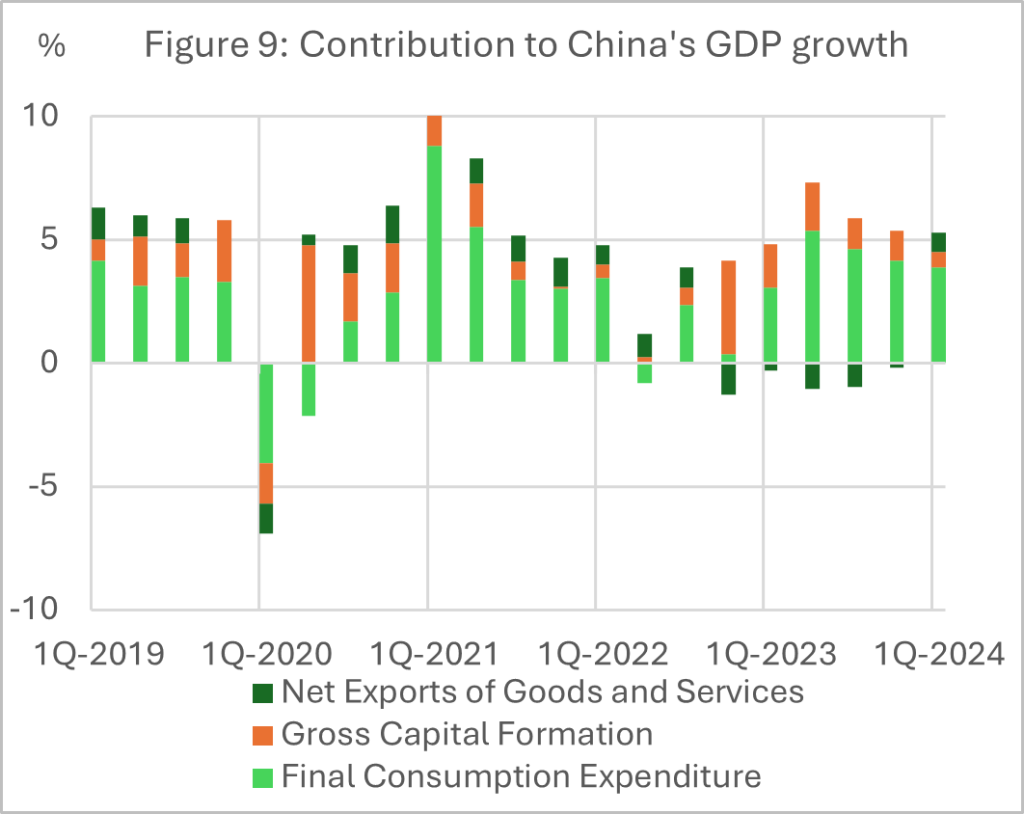
The high household savings rate in China has been conducive to economic development over the past few decades through the channelling of funds towards investment. It is thus no surprise that China also has one of the world’s highest investment rates. However, the flip side of this phenomenon is a persistent low share of consumption’s contribution to economic growth. While final consumption expenditure (see Figure 9) contributed significantly to total GDP growth in China, the role of private consumption was much lower. In 2023, China’s private consumption as a percentage of GDP stood at 39.2%. This compares with 63.6% in India (latest available data), 56.4% in Indonesia, 53.6% in Japan and 67.6% in the US.[14] Mirroring this, China has a heavier reliance on net exports and investment to drive its economic growth. In order to rebalance the economy, the Chinese government has since strategised to increase the contribution of consumption. This necessitates Chinese households to loosen their purse string and reduce precautionary savings.
A strong preference to save than to spend
However, recent data show that Chinese households are doubling down on saving. It was estimated that Chinese households put aside an additional CNY6.6 trillion (USD 1 trillion) in excess savings in 2023[15]. The rate of increase in household deposits has moderated but remained high in early 2024 (see Figure 10). Meanwhile, results of the Q1 2024 Urban Depositor Survey Report issued by the People’s Bank of China also show a persistent widening share of consumers preferring to save more, at 61.8% (see Figure 11)[16]. Even when households are willing to spend, the top choices are education and healthcare, which are investments in their children and their future.
Figure 10&11: Chinese consumers’ willingness to consume, save and invest
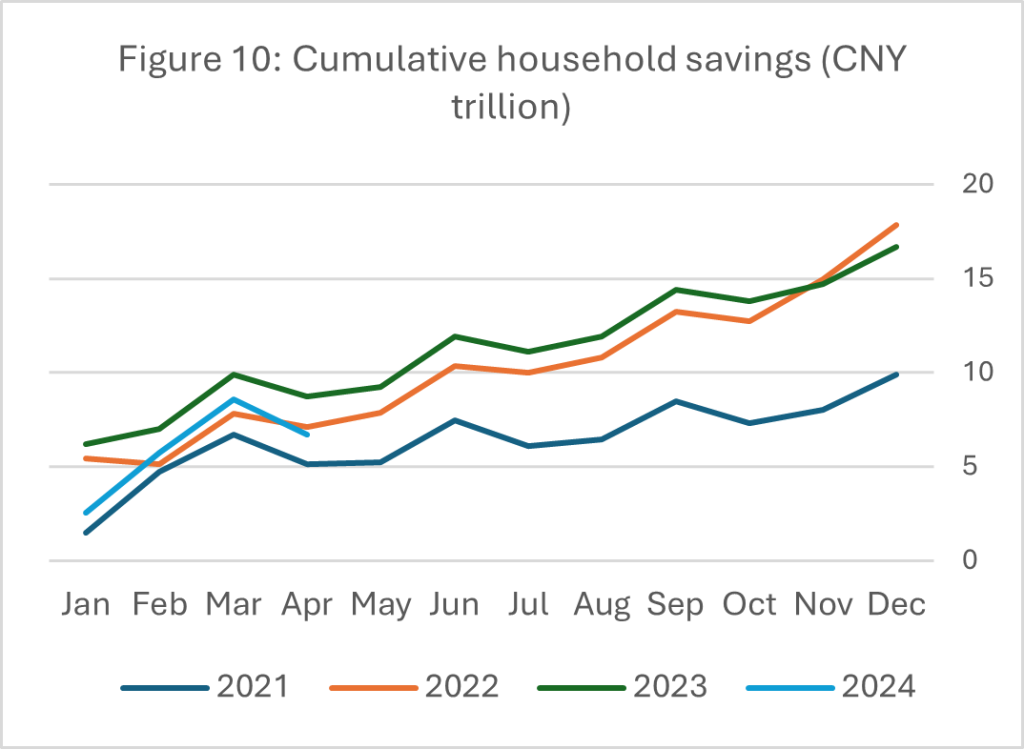
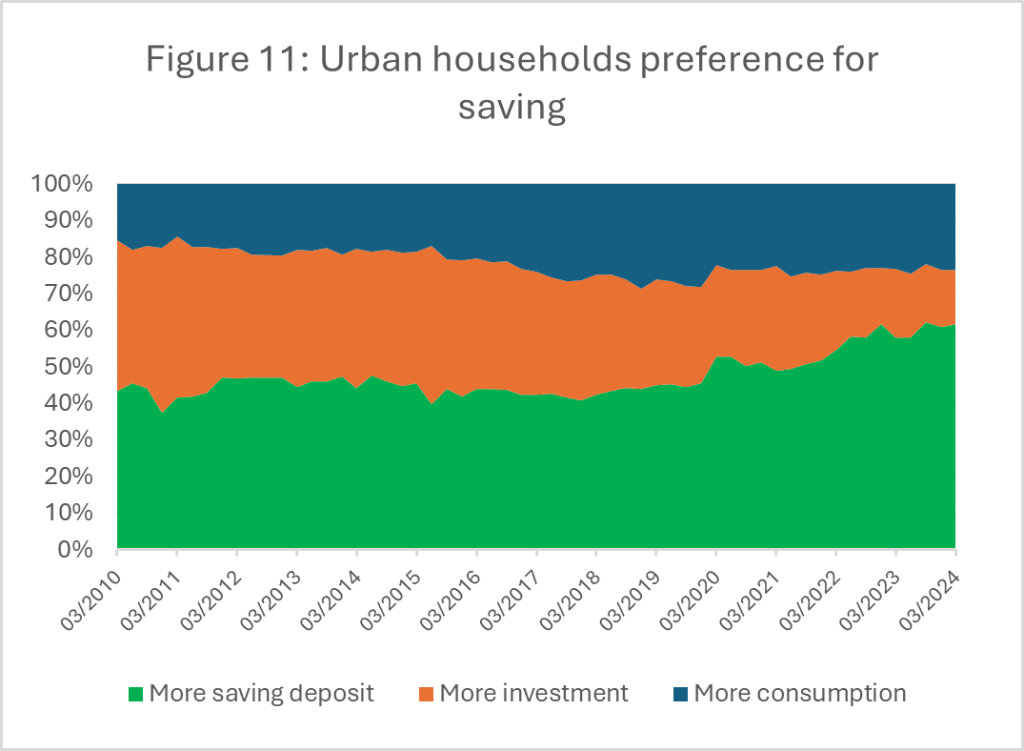
Source: CEIC
A desire to save for retirement, medical bills and children’s education are among the key reasons behind China’s high household savings rate. A survey conducted in 2022 by Peak Re showed that Chinese consumers are more likely than their peers in other Asian markets to set aside some savings as healthcare funds (see Figure 12).
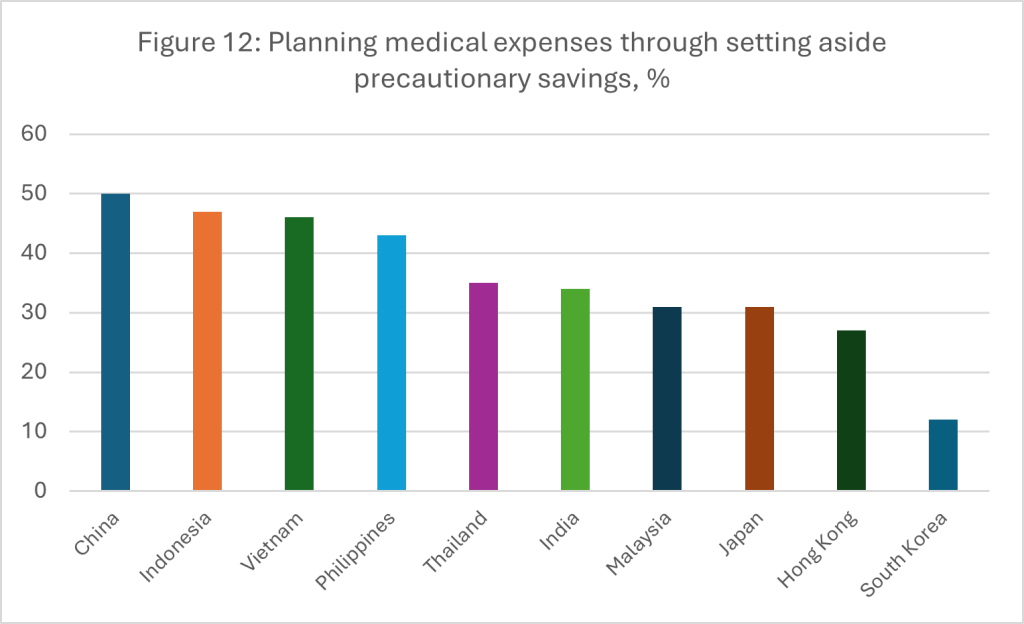
Source: Peak Re Emerging Asia Consumer Survey 2022. Q: “How do you usually plan for your personal medical expenses?”
Why is the high savings rate a concern? Domestically, it means consumers are not spending sufficiently to drive a more balanced economy. To effect a meaningful shift, however, the government would need to make some uncomfortable choices regarding the structure of income and spending. For example, this will require labour to receive a higher share of national output than corporations and the public sector.
Externally, China’s large household savings rate is mirrored in the country’s sizeable external imbalances (surplus to China). China hopes a huge expansion in investment in renewable energy and the expansion of the new economy sectors can keep both savings and investment rates high for a more extended period. However, this could still eventually lead to the challenge of the need for exports and limits on markets abroad. By reducing the household savings rate, China could achieve more balanced growth with a more significant share derived from domestic consumption and reduce its reliance on net exports and investment.
There are several reasons why consumption is weak, and savings are high. First, per capita disposable income growth has remained relatively subdued. Second, consumer sentiments remain depressed due to the recent problems with the property market and the negative wealth effect.
Savings rates: Higher for longer?
A high level of savings has been instrumental in supporting the growth of insurance in China, particularly life insurance. Life insurance premiums in China have grown, averaging 12% per annum over the past two decades. In 2022, China was the world’s second-largest life insurance market, with an estimated life premium volume of USD364 billion.[17] What would happen if China’s household savings started falling?
With lower precautionary savings set aside for unexpected expenditures, consumers might be more willing to buy insurance to protect themselves against external shocks now that insurance offerings are comprehensive and competitive. That would imply a shift of demand from savings-type to protection-oriented insurance products.
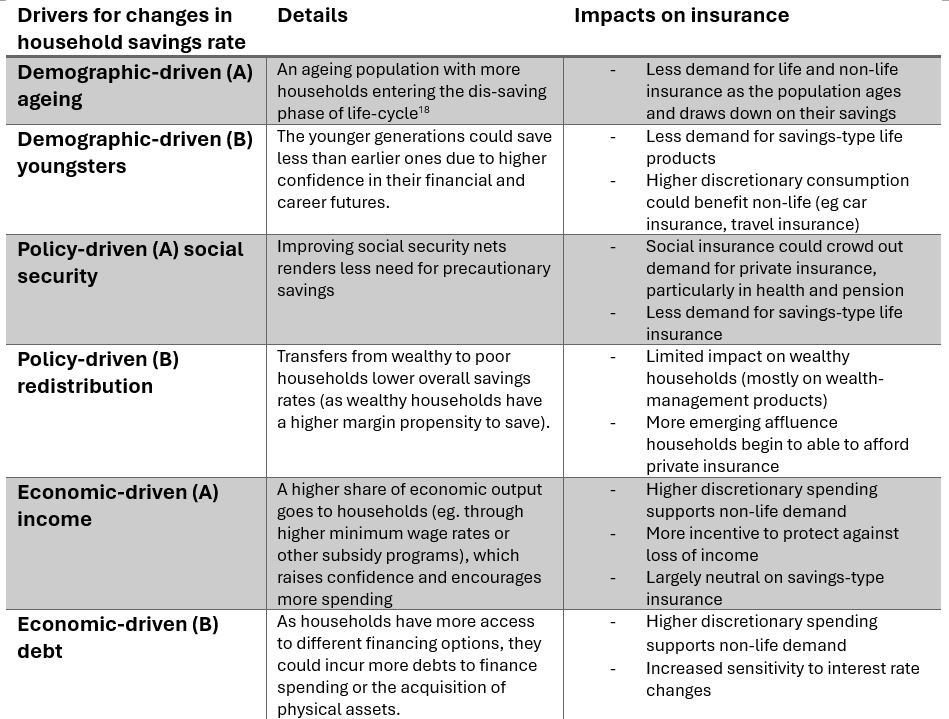
Nonetheless, the precise impact on insurance could also hinge on the drivers behind changes in the household savings rate. The table below summarises the key drivers and possible impacts. For example, if the savings rate drops as a result of a fast and further improvement in social security, this could crowd out private insurance and dampen demand for wealth-management products. On the other hand, the household savings rate could decline as a result of stronger fiscal redistribution policies. This is because wealthier households typically have a higher marginal propensity to save. A redistribution from wealthier to less well-endowed households means the overall savings rate could decline. In this case, it could be expected that wealth-management demand from higher-end households could drop, but insurance demand from the emerging affluence consumer group could increase. These examples illustrate the need to understand the logic behind changes in the savings rate in order to assess the impact on insurance.
Table 1: Divers for changes in household savings and impacts on insurance
Source: Peak Re Research
Concluding remarks
A high level of savings among Asian markets, both matured and developing, has been instrumental in supporting fast economic development in the past. As markets in the region continue to mature, the aggregate savings rate has trended downward over the past decades, though it still remains significantly higher than that in major advanced markets.
The intricate balance act of supplying sufficient funds to finance investment while not suppressing domestic consumption is a perpetual issue. This is further complicated by imperfect funds flows, particularly in today’s increasingly fragmented world. Nonetheless, while improving public social security provisions reduces the need for precautionary savings, higher consumer expectations and increasing economic uncertainty keep savings high in some markets.
Savings and the need to protect them are major motives behind the demand for insurance, particularly life insurance. However, it is not easy to act only on the observed savings rate without understanding its nuance. Japanese households recorded low and even negative savings rates in recent quarters. This was due to higher expenditure (due to inflation) and stagnating income growth. Consumer sentiment remains weak. In India, the household savings rate is falling as well, but this is likely due to improving consumer sentiment and the fact that they are more confident and willing to borrow.
In sum, we can only understand consumers’ choices between saving and spending if we understand their reasons for making these choices. Much work still needs to be done.
[1] Piotr Misztal, The relationship between savings and economic growth in countries with different levels of economic development, Financial Internet Quarterly, June 2011.
[2] It should be noted that most advanced Asian markets currently have lower savings rates but much higher ones when they were still categorised as “emerging markets.”
[3] This article considers how savings drive demand for insurance. The availability of insurance as a long-term saving vehicle could also have the effect of raising the household and national savings rate.
[4] Rudolf Enz, The S-Curve Relation Between Per-Capita Income and Insurance Penetration, The Geneva Papers on Risk and Insurance Vol. 25. No.3 (July 2000). Other studies have largely confirmed a positive correlation between income and insurance demand. See Cargill & Troxel (1979), Babbel (1985), Browne &Kim (1993), Outreville (1996), Rubayah and Zaidi (2000), Munir et al. (2012) and Outreville (2015).
[5] In Do Hwang, Behavioral aspects of household portfolio choice: Effects of loss aversion on life insurance uptake and savings, International Review of Economics & Finance, Vol. 89, Part A, January 2024. The author argued that rational consumers would consider term life a “risky investment” since the policyholders might lose all the premiums if the policy expires without a claim. Risk-aversive consumers would instead opt for life policies with premium-return features like a whole life insurance policy.
[6] Nurul Shahnaz Mahdzan & Sarah Margaret Peter Victorian, The Determinants of Life Insurance Demand: A Focus on Saving Motives and Financial Literacy, Asia Social Science, Vol 9, No.5, 2013.
[7] Pandemic Savings Are Gone: What’s Next for U.S. Consumers? Federal Research Bank of San Francisco, May 2024
[8] Source: IMF World Economic Database April 2024.
[9] Global Debt Database, the IMF (see link)
[10] The corresponding household financial liability to GDP ratio, as reported by the RBI, was 36.9% at the end of FY2021-22. News reports suggest the ratio has risen further to close to 40% by the end of 2024 (see link).
[11] https://www.imf.org/-/media/Files/Publications/GFSR/2017/October/chapter-2/Documents/C2.ashx
[12] China’s excess savings are a danger, Financial Times, 6 March 2024.
[13] See China’s High Savings: Drivers, Prospects, and Policies, IMF Working Paper, December 2018.
[14] Source: CEIC. Figures for individual markets refer to the latest available and could vary across markets.
[15] This is on top of an increase of CNY17.8 trillion in household savings (USD2.5 trillion) in 2022 (link) (see Figure 8). The large increase in 2022 was likely pandemic-driven excess savings. However, the rise in 2023 reflected persistent weak consumption demand (and the absence of significant “revenge spending” in 2023).
[16] Urban Depositor Survey Report (Q1 2024), People Bank of China (link)
[17] “World insurance: stirred, and not shaken”, sigma no.3/2023, Swiss Re Institute
[18] There could be other factors that can disrupt this logic. For instance, the national savings rate of Japan was 29.7% in 2024, which is also the same as the level in 1980, at 29.7%, despite the rapid ageing of its population over the last four decades. The drop in household savings was largely offset by higher savings in the corporate sector. Other studies, meanwhile, showed that baby-boomers are still maintaining a high savings rate (saving their pension income), in contrast to textbook predictions. See Baby-boomers are loaded. Why are they so stingy, The Economist, 26 May 2024.
Other Insights

Wed, 9 Jul 2025
| 16 mins
|
Kritika Kashyap

Wed, 21 May 2025
| 19 mins
|
Kritika Kashyap
Fri, 25 Apr 2025
| 19 mins
|
Clarence Wong

Wed, 16 Apr 2025
| 14 mins
|
Kritika Kashyap

Fri, 21 Mar 2025
| 8 mins
|
Limin Chen

Elevate Your Business
with Peak Re
with Peak Re